Use multiple dimensions together in the same report.
Pair metrics and dimensions of different scopes.
The correct answer: Pair metrics and dimensions of different scopes.
Explanation:
You can’t mix different types of data in a report. In Google Analytics, each type of data has its own category. It is best to combine the same data types. Also, it’s essential to know the difference between the data types. A type called “dimension” describes things with different qualities, while a type called “metric” measures things with numbers, like totals or ratios.
The Dimension & Metric Explorer is a valuable tool for checking which data types can be assembled. It helps you find valid combinations, organize them by characteristics, explore all the possible data types, and more.
Analytics will not be able to associate user behavior data with past data collected.
Analytics will set a new unique ID the next time a browser loads a tracked page.
Analytics will set a new browser cookie the next time a browser loads a tracked page.
All of the above.
The correct answer: All of the above
Explanation:
If a web page visitor clears the Analytics cookie from their browser, Analytics cannot associate user behavior data with past data collected. It will set a new unique ID the next time a browser loads a tracked page. It will set a new browser cookie the next time a browser loads a tracked page.
For Google Analytics to determine that two distinct hits belong to the same user, a unique identifier associated with that particular user must be sent with each hit.
Using cookies allows analytics.js to identify unique users across browsing sessions but cannot identify unique users across different browsers or devices.
Not every metric can be combined with every dimension. Each dimension and metric has a scope: user-level, session-level, or hit-level. In most cases, combining dimensions and metrics that share the same scope makes sense.
The above answer and explanation are related to the Google Analytics individual qualification exam. You can find all the updated questions and answers related to the Google Analytics individual qualification exam on the “Google Analytics individual qualification exam” page. If you find any error or update in questions or answers, comment below and let us know. We will update the answers as soon as possible.
Here’s a Google Analytics practice question along with its answer. To succeed in the Google Analytics certification exam, you should be able to handle similar questions. Even though the question on this topic has been answered, you might still want an explanation. Check out the article below for a detailed breakdown of the question and its answer.
Explained:
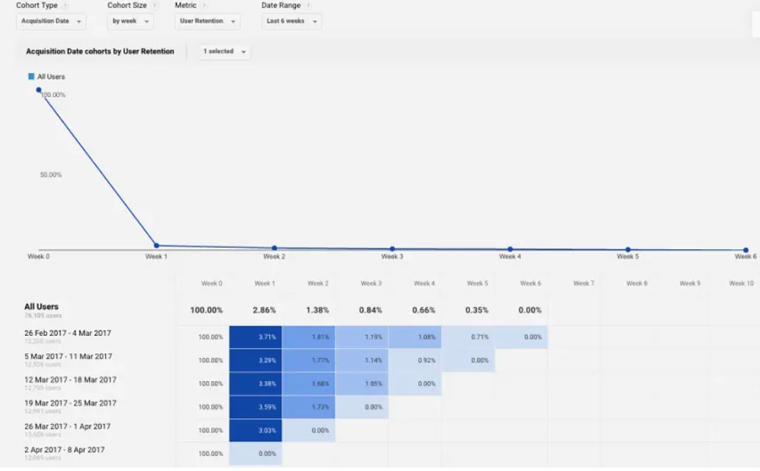
Which Report Compares Metrics by User Acquisition Date Across Weeks?
Rewrite this sentence and make it simple “Through Cohort analysis, you can understand the behavior of different component user groups apart from the user population. Examples of how cohort analysis can be used include how you can see the individual user’s behavior and performance. However, I would like to know more about cohort and cohort analysis. In that case, you need to follow the sections below.
What are Cohorts?
A cohort is when we group people based on the date they first appeared on a website. For instance, if someone visits a website on April 25, they’re in the April 25 cohort, the April month cohort, and the fourth week of the April cohort. This means they’re in different groups for April. A fellow begins when the website first gets a visitor. But, for May, you won’t join that month’s cohort.
What Is Cohort Analysis?
Cohort analysis helps marketers and businesses study how customers behave in different groups. It looks at how people’s behaviors change over time.
For example, if a marketer emails 100 people, only a few might buy on the first day. Then, a few more might buy on the second and third days. But, when the same email goes out to another 100 people weeks later, some might buy on the first day. Cohort analysis lets you study these groups based on when they were acquired and how they behave.
This analysis also shows how their opinions and behaviors change over time. You can learn exciting things, like how the first email might lead to better conversions. Plus, those who buy in the second week might stick around longer.
Cohort analysis gives insights into important metrics like retention, engagement, acquisition, response to trends, and marketing impact.
What Is Cohort Analysis Good For?
Cohort analysis significantly impacts customer engagement, retention, and other essential areas. This technique also has a strong influence on your digital marketing efforts.
Both physical stores and websites undergo changes, which can happen more often if you’re doing things well. Such changes also influence how users act on your website. Using cohort analysis, you can see how these website changes affect users.
I’ve listed various factors here that can alter user behavior on your website:
– Who you’re targeting
– The channels you use
– The ads you show
– When you redesign your website
– Any experiments or campaigns you run
– Introducing new services or products
– Running sales, promotions, and discounts
Limitations Of Google Analytics Cohort Analysis
Cohort analysis might seem helpful in theory, but it has its limitations. Google Analytics has some constraints when it comes to cohort analysis. Here are a few rules you should know about:
1. While you can group cohorts by audience characteristics, Google Analytics only lets you create cohorts based on acquisition dates.
2. Google Analytics does offer a way to track returning users and their retention. However, there are cases where this tracking falls short:
– When users clear their browser cookies
– When users visit the site in incognito mode
– When users use a different device or browser
3. Lastly, there can be complications from other factors that affect your data. We talked about this earlier. To better understand how metrics change with different marketing activities, it can be helpful to overlay your cohort data with a marketing calendar.
Bottom Line
Until recently, it was hard to do cohort analysis on Google Analytics. You had to set a special date for when users joined. Using this method, the correct answer to the question is ‘custom dimension.’ This article was useful. If you have more questions, please ask in the comments.
The correct answer:(D) Demographics and Interests reports.
Explanation.
To get Demographics and Interests info in Analytics, update Analytics to support Ad Reporting Features and enable those reports. When you allow Ad Reporting Features, Analytics can get more data from DoubleClick cookies (web) and Device Advertising IDs (apps).
Google Analytics is a helpful tool for website owners to understand their online audience and performance. To make it even more powerful, users can turn on Ad Features. These features give extra data about user details. In this article, we’ll talk about the reports that need Ad Features and why they matter.
Ad Features are parts of Google Analytics that give website owners more visitor data. They include Remarketing, Demographics, Interests reports, and DoubleClick Campaign Manager links. With these features, Google Analytics can gather more user data like age, gender, and interests.
Demographics and Interests Reports
The Demographics and Interests reports show your website visitors’ ages, genders, and interests. These reports help you know your audience better and improve your marketing. When you turn on Advertising Features, you get this extra info. It enables you to make content that fits your audience and improves your marketing strategy.
Remarketing
Remarketing lets you display ads to people who visited your website before as they check out other sites on the Google Display Network. When you turn on this tool, you can make ads that suit them better, which makes it more likely they’ll become your customers.
DoubleClick Campaign Manager Integration
The DoubleClick Campaign Manager connection helps you see how well your online ads are doing. Suppose you connect your Google Analytics and DoubleClick accounts. In that case, you can follow what users do on different devices and channels to understand how your ads work.
So, the correct answer is D) Demographics and Interests reports. These reports need Advertising Features to get more data about users’ details. With this info, website owners can make just the right content and improve how they do marketing.
In short, Google Analytics is an excellent tool for website owners. By turning on Advertising Features, users can learn more about their visitors. The Demographics and Interests report helps you better understand your audience and do marketing. This data helps website owners make personalized content and boost their chances of turning visitors into customers.