Gives users specific information about what you’re offering, before they visit your website.
Lets you show your business address, phone number, and a map marker alongside your ad text.
Allows potential customers to navigate to specific pages of your website directly from the ad.
Lets you quickly display information about your promotions without having to update every ad.
The correct answer: Gives users specific information about what you’re offering, before they visit your website.
Explanation. Structured snippet extensions provide users with specific information about your offerings before they navigate to your website.
Emphasize particular features of your products and services through structured snippet extensions, which display below your text ad as a header and a list of values.
The response and explanation above address the query regarding the primary advantage of incorporating structured snippet extensions into your advertisements.
Set bids and budgets by using last-click conversions.
Use Performance Planner on an annual basis.
Create account-level plans that combine all campaigns.
Check your plan regularly close to the run date.
The correct answer: Check your plan regularly close to the run date.
Performance Planner, a robust tool within Google Ads, can greatly assist in protecting and enhancing your ad performance. It leverages historical performance data to generate forecasts for your campaigns while offering recommendations to enhance their effectiveness. To effectively harness the capabilities of Performance Planner, here are some best practices to consider:
1. Establish Realistic Goals: Prior to utilizing Performance Planner, it is imperative to establish attainable objectives for your campaigns. While Performance Planner aids in estimating performance across various budget and bid combinations, it is crucial to ensure that your goals are feasible and in alignment with your business objectives.
2. Utilize Accurate Historical Data: The precision of your Performance Planner forecasts hinges on the quality of your historical data. Ensure that your campaigns are equipped with sufficient, accurate, and up-to-date data. If your campaigns have recently undergone significant changes, such as shifts in targeting or new product launches, it is advisable to wait until sufficient data has accumulated before employing Performance Planner.
3. Account for Seasonality: Performance Planner accounts for seasonality when crafting forecasts, but it is essential to regularly review and adapt your plan, especially if your business experiences substantial fluctuations in demand throughout the year.
4. Experiment with Various Scenarios: Performance Planner grants you the flexibility to experiment with diverse budget and bid scenarios. Take advantage of this feature to identify the most effective combinations for your campaigns. Explore different budget levels, bid strategies, and targeting options to ascertain which ones yield the best results.
5. Periodically Review Your Plan: Regularly scrutinizing your plan is crucial, particularly as you approach your campaign’s launch date. Make necessary adjustments to ensure that your plan remains aligned with your goals.
6. Implement Recommended Changes: Performance Planner offers recommendations for performance enhancement, such as bid increases or the addition of new keywords. Carefully consider these suggestions and implement those that align with your business strategy.
7. Vigilantly Monitor Your Campaigns: Once your campaigns are underway, closely monitor their performance to ensure they meet your expectations. If you detect any issues, be prepared to make necessary adjustments promptly.
In conclusion, Performance Planner can prove invaluable in optimizing your Google Ads campaigns. By setting realistic goals, relying on accurate historical data, considering seasonality, experimenting with different scenarios, regularly reviewing your plan, implementing recommended changes, and closely monitoring your campaigns, you can maximize their performance and achieve your business objectives.
Explanation. Google populates fully automated extensions directly, requiring no action on your part. These extensions are displayed automatically when Google predicts they will enhance ad performance. One such mechanical extension is seller ratings, which inform users about your business’s high-quality service ratings. Google derives seller ratings scores from various data sources, contributing to their generation.
This information serves as the answer and explanation to the question regarding which ad extension is exclusively available as a fully automated ad extension.
Google directly populates fully automated extensions, requiring no action on your part. These extensions are displayed automatically when Google predicts that they will enhance ad performance.
Seller ratings represent an automated extension to inform users about your business’s high-quality service ratings. Google collects data from the following sources, which can be utilized to generate a seller rating score.
For additional information, please visit the Skillshop Search Certification, specifically in the fifth chapter titled ‘Make Ads Relevant with Search Ad Extensions,’ under the sub-chapter ‘Choosing the Right Ad Extensions.
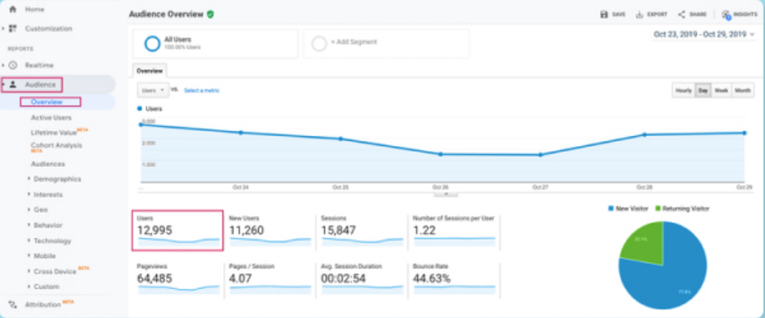
If you manage a website, understanding how often your visitors return is essential. This metric is critical for monitoring your website’s growth. To determine the percentage of returning traffic, you should access the ‘New vs Returning Visitor’ report in Google Analytics.
By tracking this metric through Google Analytics, you’ll gain valuable insights about your website. Additionally, you’ll be able to assess the effectiveness of your marketing strategies and gauge your target audience’s loyalty and engagement with your business.
Guidelines for Monitoring Returning Visitors on Your Website
Here are the steps you should follow to access the ‘New vs Returning Visitor’ report:
Step 1: Open a web browser and log in to your Google Analytics account using your username and password.
Step 2: Select the website for which you want to view the traffic.
Step 3: In the left-hand menu section, navigate to the “Audience” option.
Step 4: Within the “Audience” subsection, choose the “Behavior” option.
Step 5: Under the “Behavior” category, you will find various report types. Click on “New vs Returning.”
Job Of The ‘New vs Returning’ Visitor Report
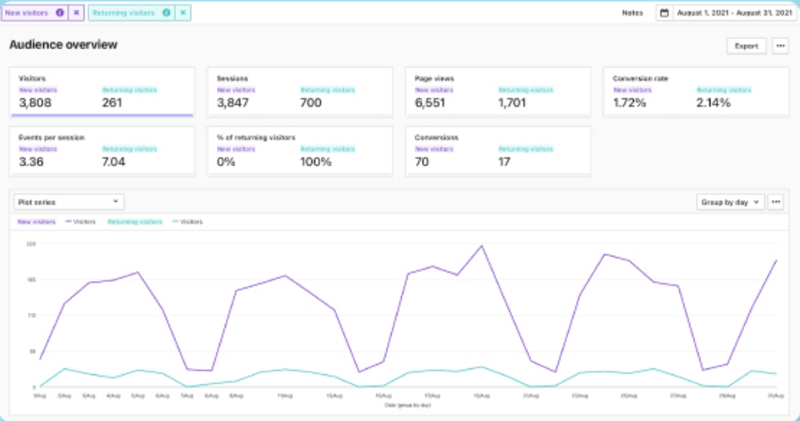
The ‘New vs Returning Visitor’ report allows you to gauge the number of new and returning visitors to your website by comparing the two. When you specify a date range in the report section, it presents a percentage comparison of new visitors versus returning visitors.
Within this report section, you’ll notice a date range selector at the top of the page. You can utilize this tool to view data within a specific time range. Alternatively, if you stick with the default settings, you’ll see a comparison of data for the past thirty days.
It’s important to note that this returning visitor report tool counts visitors who have previously visited your site and accepted website cookies in their browsers. If a visitor has allowed cookies or is using a different browser or device, Google will categorize them as a new visitor, even if they’ve visited your site before.
The Benefits of Tracking Returning Visitors: Why It’s Important
Here are the key benefits you’ll experience when you start using the New vs Returning visitor report to track your returning visitors:
1. Effective examination of your website content quality, including text, images, infographics, and videos.
2. Greater room for improvement on your website.
3. Enhanced options for assessing your website strategies more effectively.
4. Increased revenue generation due to improved website traffic.
5. Deeper insights into your target audience, their browsing habits, online behaviors, and preferences.
6. Improved conversions and engagement through action based on each report about your website’s performance.
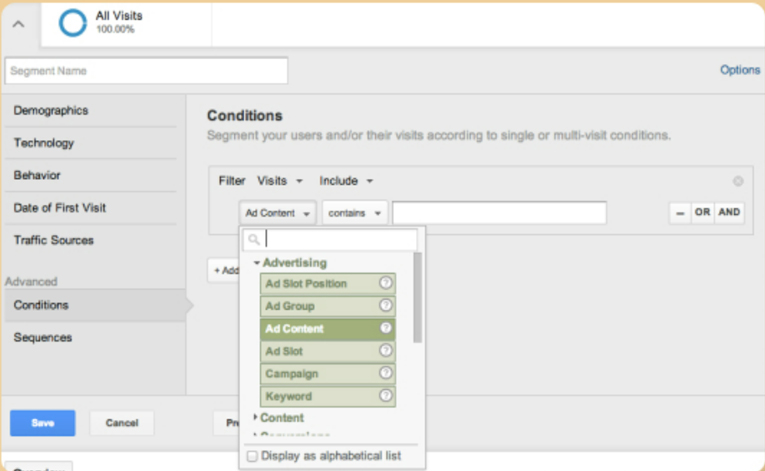
Analyze users by single or multi-session conditions
Compare behavior metrics for groups of users like Converters vs non Converters
Isolate and analyze specific conversion paths using conversion segments
The correct answer: Permanently modify the data in a view
Explanation: In Google Analytics, a segment represents a portion of your Analytics data. Generally, segments allow you to isolate and analyze specific data subsets for better analysis. You can also use segments as a foundation for creating audiences. It’s important to note that segments do not make permanent changes to the data in your views, unlike filters. However, it’s a good practice to always retain the original view as a backup in case you apply filters that permanently modify the data. Keep in mind that this caution applies to filters, not segments.
You may already know that using a Segment is essential in Google Analytics.
By employing data segments, you can refine the aggregated data from Google Analytics, transforming it into the format you prefer. Segmented data assists you in addressing particular inquiries about your customers and leads, and you can apply the segment across various sections. Furthermore, the segments remain intact when you switch between sections.
What Are the Disadvantages of Using Segments for Data Analysis?
Among the four options discussed in this article, the first option is the correct one. When considering the advantages of using Segments for data analysis, the first option is the exception.
From the earlier section on Segments, you should already understand that Segments consist of single or multiple non-destructive filters, meaning these filters do not alter the underlying data. They are used to isolate subsets of users, hits, and sessions, and they do not allow for permanent data modification within a single view. Segments can also serve as a foundation for creating audiences.
However, all the other options mentioned represent the benefits of using Segments for data analysis. For instance, you can analyze users based on multiple or single session conditions, and you can also examine and isolate specific conversion paths using conversion segments. Keep in mind that permanent data modification in the view is not possible with Segments.
Explanation: A reporting view represents the level within an Analytics account where reports and analysis tools are accessible. Analytics automatically generates an unfiltered view for each property in your account; however, you can configure multiple views for a single property. Any data transmitted to an Analytics property will automatically appear in all associated views.
The information provided above pertains to the Google Analytics Individual Qualification Exam. For the most up-to-date questions and answers related to this exam, please visit the ‘Google Analytics Individual Qualification Exam’ page. If you come across any errors or updates in the questions or answers, please leave a comment below to notify us, and we will promptly make the necessary updates.
A reporting view within an Analytics account allows you to access reports and analysis tools.
Analytics automatically generates one unfiltered view for each property in your account, but you have the option to configure multiple views for a single property. Any data you transmit to an Analytics property will automatically populate all associated views. For instance, if you collect data from two websites and send it to a single property, the data from both websites will be visible in all reporting views linked to that property. This applies equally to web and app data. If you gather data from a mobile app and a website, and both your SDK and tracking code forward data to one property in your Analytics account, all data, encompassing both web and app hits, will be present in all reporting views associated with that property.
Filters can be employed to personalize views, allowing you to focus on specific subsets of data in your reports. For instance, you may create one view to filter out all internal traffic and another to exclusively include activity from a particular website directory or subdomain. In cases where web and app data are sent to the same property, you may consider using filters to exclude either web or app data from specific views. Additionally, various Analytics reporting tools such as Goals, Segments, and Alerts are applied at the individual view level. You also have the option to restrict user access to specific views, enabling you to manage who has access to particular sets of data.
We strongly advise against deleting or adding filters to your original view. Deleting a view erases the historical perspective of the data associated with it. Adding filters to a view restricts access to excluded data. To preserve your original data while controlling various data perspectives, consider creating a duplicate of your original view or establishing additional views and customizing each one to align with your reporting objectives.